Wireshark is the world’s most advanced network protocol analyzer. It allows you to see at the microscopic level what is happening in your network. today we will learn how to use wireshark filter

Wireshark Starter Filters
In Wireshark just a huge number of various filters. And there is a lot of documentation on these filters, which is not so easy to understand. I collected the most interesting and most frequently used Wireshark filters for me. For novice users, this can be a bit of a Wireshark filter reference, a starting point for exploring. Also here in the comments I suggest you share the running filters that you often use, as well as interesting finds – I will add them to this list.
Remember that Wireshark has display filters and capture filters. Here I consider the display filters that are entered in the main window of the program in the top field immediately below the menu and icons of the main functions.
Some filters are written here in a general form, and some are made as concrete examples. Remember that in any case you can substitute your data, for example, change the port number to any one of your interest, and also do the same with the IP address, MAC address, time value, etc.
Wireshark Filter Operators
Filters can have different values, for example, it can be a string, a hexadecimal format, or a number.
If an inaccurate occurrence is sought (better suited for non-numeric values) then contains is used . For example, to show TCP packets containing the string kalitut you need the following filter:
tcp contains kalitut
Operators are used to find exact values. Consider them:
| Operator | Description |
|---|---|
| !ERROR! A2 -> Formula Error: Unexpected operator '=' | Equally |
| ! = / ne | Not equal |
| Less than | |
| <= / le | Less or equal |
| > / gt | More than |
| > = / ge | More or equal |
As you can see, there are two spellings, for example, if we want to indicate that the filter value is equal to something, then we can use == or eq .
Filters using logical operands can be used to build rather complex structures, but apparently, the same filter can be used twice with comparison operators, for example, here in an attempt to filter not one port, but the range of ports:
tcp.port>=8000 && tcp.port<=8180
then the filter value (in this case, tcp.port ) is overwritten by the last value, so as a result, instead of the expected behavior, we get the result of only the last part, in this case it is
tcp.port<=8180
Remember this bug!
When using c == (equal), this bug is missing.
Logical operators of Wireshark filters
wireshark filter Logical operators allow you to create detailed filters using several conditions at once. It is recommended to use brackets additionally, since otherwise you may not get the value you expect.
| Operator | Description |
|---|---|
| and / & | Logical AND, data are output if they correspond to both parts of the filter. For example, the filter ip.src == 192.168.1.1 and tcp will show only packets that originate from 192.168.1.1 and which are associated with the TCP protocol. Only data matching both conditions will be displayed. |
| or / || | Logical OR, it is enough that only one condition is true; if both are true, then this also fits. For example, the filter tcp.port == 80 or tcp.port == 8080 will show TCP packets that are connected (are the source or destination) to port 80 or 8080. |
| not /! | Boolean is NOT used when we want to exclude some packages. That is, all packets will be displayed, except those that satisfy the condition following the NOT. For example, the filter ! Dns will show all packets except DNS. |
Combination examples:
Show HTTP or DNS traffic:
http or dns
Show all traffic except ARP, ICMP and DNS:
!(arp or icmp or dns)
Interface Filter
Show packets only sent or received on the wlan0 interface:
frame.interface_name == "wlan0"
Link Layer Protocol Traffic
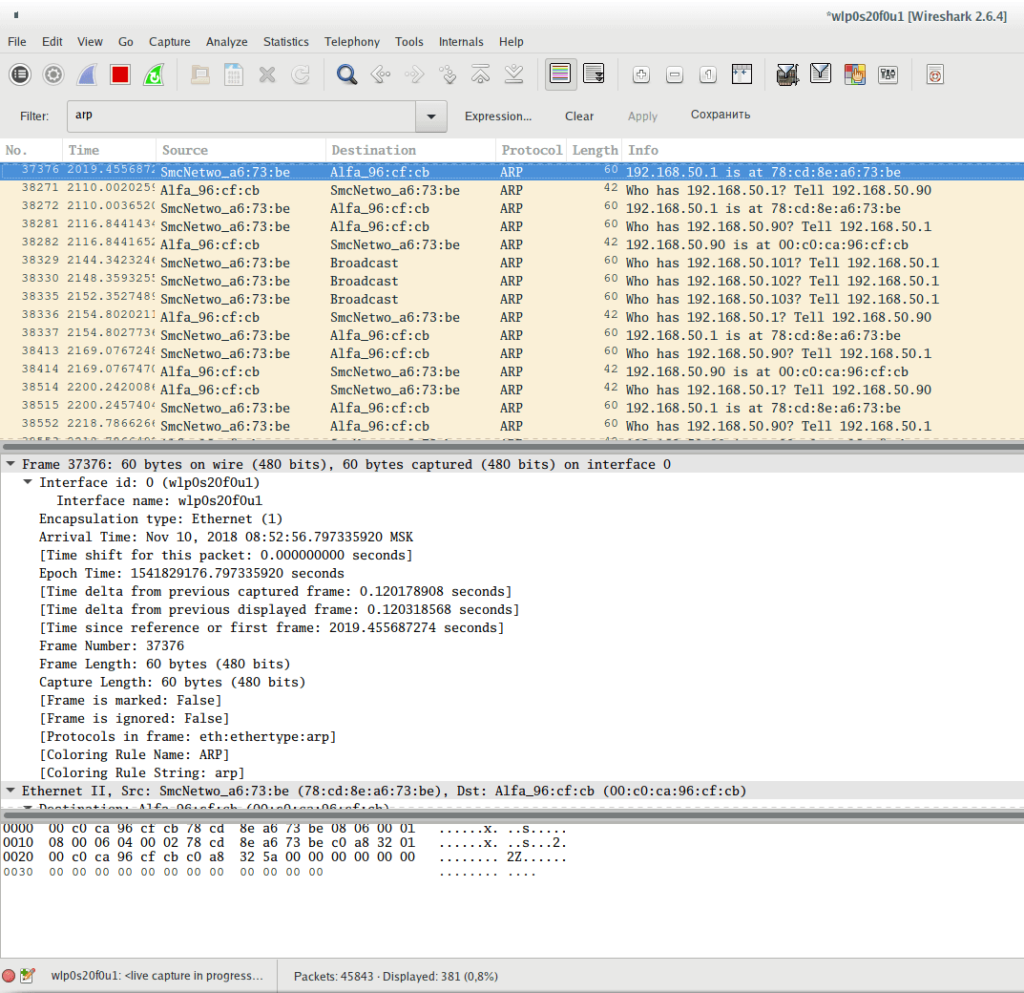
To show ARP traffic:
arp

Show ARP protocol frames sent from device with MAC address 00: c0: ca: 96: cf: cb:
arp.src.hw_mac == 00:c0:ca:96:cf:cb
Show ARP protocol frames sent from a device with an IP address of 192.168.50.90:
arp.src.proto_ipv4 == 192.168.50.90
Show ARP protocol frames sent to a device with a MAC address 00: 00: 00: 00: 00: 00 (this address is used when the protocol tries to find out the target MAC address. Another popular address that can confuse you is ff: ff: ff: ff: ff: ff, this address is broadcast, that is, messages with this address are for all devices on the local network):
arp.dst.hw_mac == 00:00:00:00:00:00
Show ARP protocol frames sent to a device with an IP address of 192.168.50.1:
arp.dst.proto_ipv4 == 192.168.50.1
Show Ethernet traffic:
eth
Show frames (in general, all frames, not just ARP, as it was in the previous examples) sent from a device that has the MAC address 00: c0: ca: 96: cf: cb:
eth.src == 00:c0:ca:96:cf:cb
Show frames sent to device with MAC address 78: cd: 8e: a6: 73: be:
eth.dst == 78:cd:8e:a6:73:be
Internet Protocol Protocol Traffic
wireshark filter Show IP traffic (this includes TCP, UDP, as well as application level protocols DNS, HTTP – that is, almost everything except the data link layer protocols that do not use IP addresses for data transmission (in local Ethernet networks they use MAC addresses)):
ip
More precisely, it means IPv4 traffic, which is usually called just IP (Internet Protocol). Show traffic associated with a specific IP address (enter it instead of xxxx). Packets will be shown in which this IP address is the source of the data OR the recipient:
ip.addr == x.x.x.x
Show traffic associated with these two IP addresses. According to the only possible logic, one of these addresses will be the source, and the second – the delivery address.
ip.addr == x.x.x.x && ip.addr == y.y.y.y
Show traffic originated from the host with the IP address 138.201.81.199:
ip.src == 138.201.81.199
Show traffic destined to a host with IP address 138.201.81.199:
ip.dst == 138.201.81.199
Please note that IP protocol operates with IP addresses, but does not operate with ports. Ports are part of the TCP and UDP protocols. IP protocol is only responsible for routing traffic between hosts.
Show IPv6 traffic (Internet Protocol version 6):
ipv6
Other filters with an IP address are similar for IPv6 and IPv4.
Transport protocol traffic
To see only TCP traffic:
tcp
Show traffic whose source or destination port is a specific port, for example, 8080:
tcp.port==8080
Show traffic originating from port 80:
tcp.srcport == 80
Show the traffic that is sent to the service listening on port 80:
tcp.dstport == 80
Show TCP packets with the SYN flag enabled:
tcp.flags.syn==1
Show TCP packets with the SYN flag enabled and the ACK flag disabled:
tcp.flags.syn==1 && tcp.flags.ack==0
Similarly for other flags: SYN
tcp.flags.syn==1
ACK
tcp.flags.ack==1
Rst
tcp.flags.reset==1
FIN
tcp.flags.fin==1
CWR
tcp.flags.cwr
ECE
tcp.flags.ecn
URG
tcp.flags.urg==1
PSH
You can also use the syntax of the form tcp.flags == 0x0XX , for example:
- FIN is tcp.flags == 0x001
- SYN is tcp.flags == 0x002
- RST is tcp.flags == 0x004
- ACK is tcp.flags == 0x010
- The ACK and FIN installed simultaneously is tcp.flags == 0x011
- The ACK and SYN set simultaneously is tcp.flags == 0x012
- The ACK and RST installed simultaneously are tcp.flags == 0x014
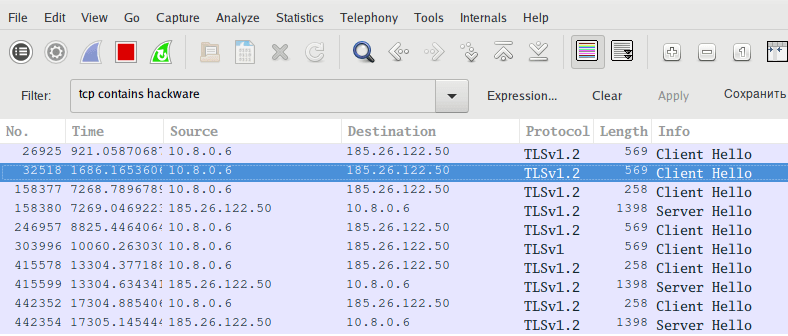
To show packages containing any string, for example, the hackware string:
tcp contains hackware

Follow TCP stream number X:
tcp.stream eq X
Filter by stream number:
tcp.seq == x
Show resubmit packets. Helps track application performance and packet loss:
tcp.analysis.retransmission
This filter displays problem packets (lost segments, resending, etc.) This filter passes TCP Keep-Alive packets, but they are not an indication of problems.
tcp.analysis.flags
wireshark filter to assess the quality of a network connection
The following specifications apply to TCP frames. Moreover, they are not based on frame headers – the considered characteristics (data omission, duplicates) are assigned by the Wireshark program based on the analysis.
The filter displays information about frames with the ACK flag, which are duplicates. A large number of such frames can talk about communication problems:
tcp.analysis.duplicate_ack_num == 1
Filter showing frames for which the previous segment is not captured:
tcp.analysis.ack_lost_segment
This is normal at the beginning of the data capture – since the information is not intercepted from the very beginning of the session.
To display frames that are retransmission (resend):
tcp.analysis.retransmission
Outputting frames that are not received in the correct order:
tcp.analysis.out_of_order
To see only UDP traffic:
udp
Flags are not used for UDP. For this protocol, you can only specify the port.
Show traffic originating from port 53:
udp.srcport == 53
Show the traffic that is sent to the service listening on port 53:
udp.dstport == 53
A UDP packet in which a specific string occurs, for example, the hackware string:
udp contains hackware
To see only ICMP traffic:
icmp
To see only ICMP v6 traffic (sixth version)
icmpv6
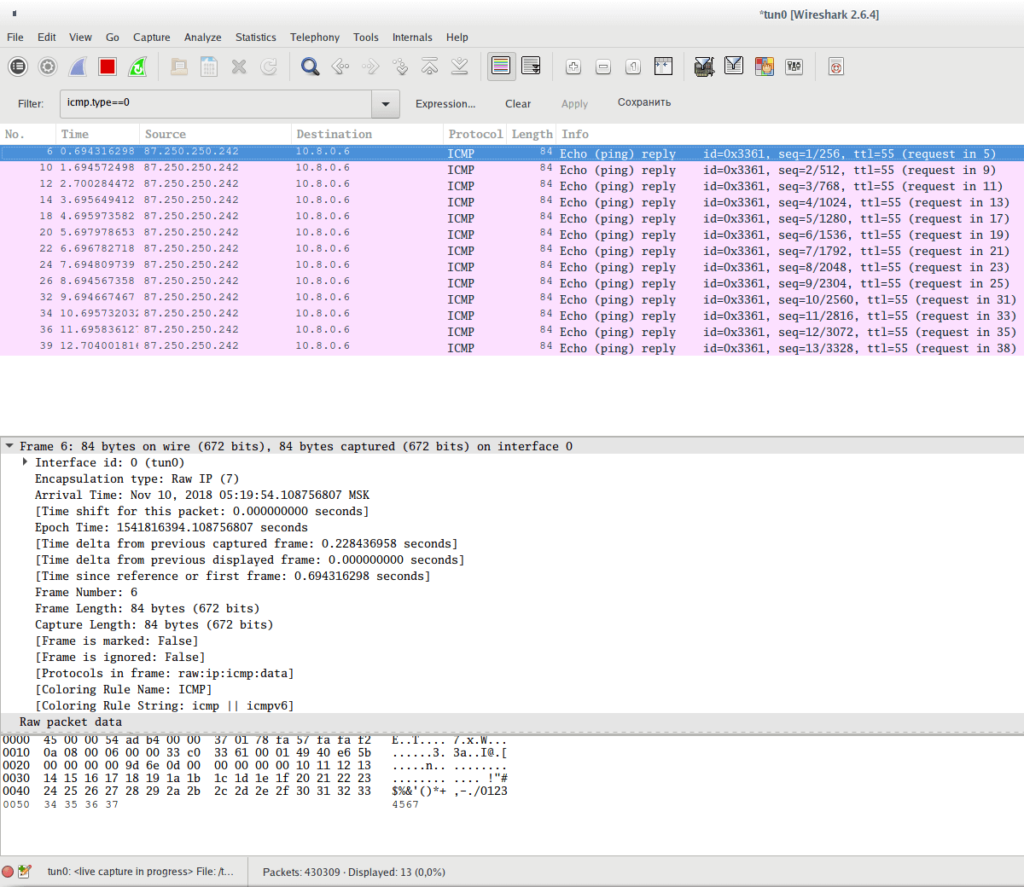
Show all answers to ping:
icmp.type==0

Show all ping requests:
icmp.type==8
Show all unavailable / denied host and port errors
icmp.type==3
Show all attempts to redirect routing using ICMP:
icmp.type==8
An example of using the CODE value, the following filter will show the port unavailable messages:
icmp.type==3 && icmp.code==3
Application Protocol Traffic
For the enclosed protocols HTTP, DNS, SSH, FTP, SMTP, RDP, SNMP, RTSP, GQUIC, CDP, LLMNR, SSDP we have wireshark filter that are called like the protocols themselves, but written in small letters.
For example, to see HTTP traffic:
http
To see the traffic of the new HTTP / 2 protocol:
http2
Remember that when deciding which protocol the transmitted data belongs to, the program proceeds from the port number used. If a non-standard port is used, the program will not be able to find the necessary data. For example, if a connection was made to SSH on port 1234, then the ssh filter would not find SSH traffic.
A filter that shows only the data sent by the POST method:
http.request.method == "POST"
A filter that shows only the data transmitted by the GET method:
http.request.method == "GET"
Search for requests to a specific site (host):
http.host == ""
Search requests to a specific site by name:
http.host contains "here.particle.name"
Filter for outputting HTTP requests in which cookies were transmitted:
http.cookie
Requests in which the server has set cookies in the user’s browser.
http.set_cookie
To search for any transferred images:
http.content_type contains "image"
To search for specific types of images:
http.content_type contains "gif"
http.content_type contains "jpeg"
http.content_type contains "png"
To search for files of a specific type:
http.content_type contains "text"
http.content_type contains "xml"
http.content_type contains "html"
http.content_type contains "json"
http.content_type contains "javascript"
http.content_type contains "x-www-form-urlencode"
http.content_type contains "compressed"
http.content_type contains "application"
Search Wireshark requests for files of a certain type. For example, to search for transferred ZIP archives:
http.request.uri contains "zip"
Instead of http.request.uri for greater accuracy, you can use http.request.uri.path or http.request.uri.query filters, for example, to search for requests to download JPG files (links to pictures):
http.request.uri.path contains "jpg"
You can also filter requests that contain a specific HTTP REFERER header value (referrer). For example, to search for queries in which the referrer is Kalitut.com:
http.referer contains "Kalitut.com"
Search requests with any authorization. Similarly, with the help of contains you can search for certain types of authorization:
http.authorization
Search for files in the HTTP stream:
http.file_data
To see which HTTP data is delayed, use the following construct:
http.time>1
It will show traffic received after 1 second.
To investigate problems, you can analyze the status of HTTP response codes. For example, the following filter will show traffic for which a 404 Not Found error was received (page not found):
http.response.code==404
The following wireshark filter is very interesting. Firstly, it shows which complex structures can be built from separate filters. Secondly, it allows you to explore HTTP requests and overall web activity, eliminating unnecessary data. With this filter, you can view high level web activity.
The rules inside the brackets exclude images, Javascript files and style sheets — everything the page requests within itself. If the examined pages contain other embedded objects, exclude them in a similar way:
http.request && !(http.request.uri contains ".ico" or http.request.uri contains ".css" or http.request.uri contains ".js" or http.request.uri contains ".gif" or http.request.uri contains ".jpg")
To see all DNS requests and responses:
dns
To see which DNS queries took a lot of time:
dns.time>1
The answers that came more than a second after sending the request will be shown.
This filter shows which dns requests cannot be correctly resolved:
dns.flags.rcode != 0
Show only DNS queries:
dns.flags.response == 0
Show only DNS responses:
dns.flags.response == 1
Show requests and responses to them in which the IP for google.com is searched:
dns.qry.name == "google.com"
Show DNS requests and responses for the A record:
dns.qry.type == 1
Show DNS requests and responses for AAAA records:
dns.qry.type == 28
Show answers in which 216.58.196.3 is sent for the A record as IP:
dns.a == 216.58.196.3
Show replies in which 2a01: 4f8: 172: 1d86 :: 1: is sent for the AAAA entry as IP
dns.aaaa == 2a01:4f8:172:1d86::1
Show CNAME posts from apollo.archlinux.org:
dns.cname == "apollo.archlinux.org"
Show answers longer than 30:
dns.resp.len > 30
Show requests with a length of more than 25:
dns.qry.name.len >25
Show DNS server responses for which recursion is available:
dns.flags.recavail == 1
Show DNS server responses for which recursion is not available:
dns.flags.recavail == 0
Is recursion desirable (if the requested DNS server does not have hostname information, should it poll other DNS servers for this information):
dns.flags.recdesired == 1
If the request is 1 , then recursion is needed, if 0 , then it is not desirable.
Whether to accept unauthenticated data ( 0 means do not accept, 1 means accept):
dns.flags.checkdisable == 0
To see how IP addresses are assigned by DHCP:
udp.dstport==67
or so:
bootp.option.dhcp
To show DHCP requests:
bootp.option.dhcp == 3
To show DHCP Discover:
bootp.option.dhcp == 1
SMB filter. This filter in the Info column shows the entire tree (ball) of connections, open directories and open files in the trace.
smb2.cmd==3 or smb2.cmd==5
Filters for WiFi frames
Show elements of four-stage handshakes (i.e. EAPOL protocol frames):
eapol
Show Beacon frames (beacons):
wlan.fc.type_subtype == 0x08
Show frames Probe Response:
wlan.fc.type_subtype == 0x05
Show all at once: EAPOL, beacons, Probe Response:
wlan.fc.type_subtype == 0x08 || wlan.fc.type_subtype == 0x05 || eapol
Show wireless frames for a specific device with the BSSID MAC address:
wlan.addr==BSSID
Show EAPOL, beacons, Probe Response for a specific device with a MAC address 28: 28: 5D: 6C: 16: 24:
(wlan.fc.type_subtype == 0x08 || wlan.fc.type_subtype == 0x05 || eapol) && wlan.addr==28:28:5D:6C:16:24
Show all PMKID:
eapol && wlan.rsn.ie.pmkid
Show PMKID, Beacons, Probe Response:
(wlan.fc.type_subtype == 0x08 || wlan.fc.type_subtype == 0x05 || (eapol && wlan.rsn.ie.pmkid))
Show PMKID, Beacons, Probe Response for access point with MAC address 40: 3D: EC: C2: 72: B8:
(wlan.fc.type_subtype == 0x08 || wlan.fc.type_subtype == 0x05 || (eapol && wlan.rsn.ie.pmkid)) && wlan.addr==40:3D:EC:C2:72:B8
Show only the first message of the handshake:
wlan_rsna_eapol.keydes.msgnr == 1
Show only the second message of the handshake (can be used for the message of a handshake with any number):
wlan_rsna_eapol.keydes.msgnr == 2
Show frames for access points with a speed (Data Rate) of 1Mb/s:
wlan_radio.data_rate == 1
Show frames for access points with a speed of more than 10Mb/s:
wlan_radio.data_rate > 10
Show access points on a specific frequency:
radiotap.channel.freq == 2412
Show access points with a certain signal level:
wlan_radio.signal_dbm > -50
Filters associated with the presence of an antenna device:
radiotap.present.antenna == 1
and
radiotap.antenna == 1
If you know other interesting Wireshark filters , share them in the comments.

Hello there – nice tutorial, and thank you – I learned lots.
For my filters and columns, I stack filters and add this column (various resolved names) by right clicking columns, column prefs., add custom column: http.host or tls.handshake.extensions_server_name or kerberos.CNameString.
My filters (stacked) only work in wireshark > 3.4:
“TRUE”,”u42//Basic”,”(http.request or tls.handshake.type eq 1) and !(udp.port eq 1900) and !(ssdp)”,””
“TRUE”,”u42//Basic+”,”(http.request or tls.handshake.type eq 1 or tcp.flags eq 0x0002) and !(udp.port eq 1900)”,””
“TRUE”,”u42//Basic+DNS”,”(http.request or tls.handshake.type eq 1 or tcp.flags eq 0x0002 or dns) and !(udp.port eq 1900)”,””
“TRUE”,”u42+//Req | Resp”,”http.request || http.response”,””
“TRUE”,”u42+//DNSqry”,”dns.qry.name”,””
“TRUE”,”u42+//HTTP > 302″,”http.response.code > 302″,””
“TRUE”,”u42+//dns+Syn+Ack”,”(http.request or tls.handshake.type eq 1 or tcp.flags eq 0x012 or dns) and !ssdp”,””
“TRUE”,”name//nbns”,”nbns.flags.opcode eq 5 or nbns.flags.opcode eq 8 or nbns.addr”,”refrresh or register or ip addr”
“TRUE”,”name//dhcpName”,”dhcp.option.hostname”,””
“TRUE”,”ware//Loki”,”http.user_agent contains \x22Charon; Inferno\x22″,”Loki bot user agent string”
“TRUE”,”ware//AZOrult”,”http.user_agent contains \x22Mozilla/4.0 (compatible; MSIE 6.0b; Windows NT 5.1)\x22\x0a”,””
“TRUE”,”u42+//certData”,”(tls.handshake.type eq 11) and !(nbns) and !(udp.port == 1900)”,”certificate data for tls”
“TRUE”,”ware//MZ”,”ip contains \x22This program\x22″,”This program -> must be run on win32 / cannot be run in Dos”
“TRUE”,”ware//ftp”,”ftp.request.command or ftp-data”,”ftp information”